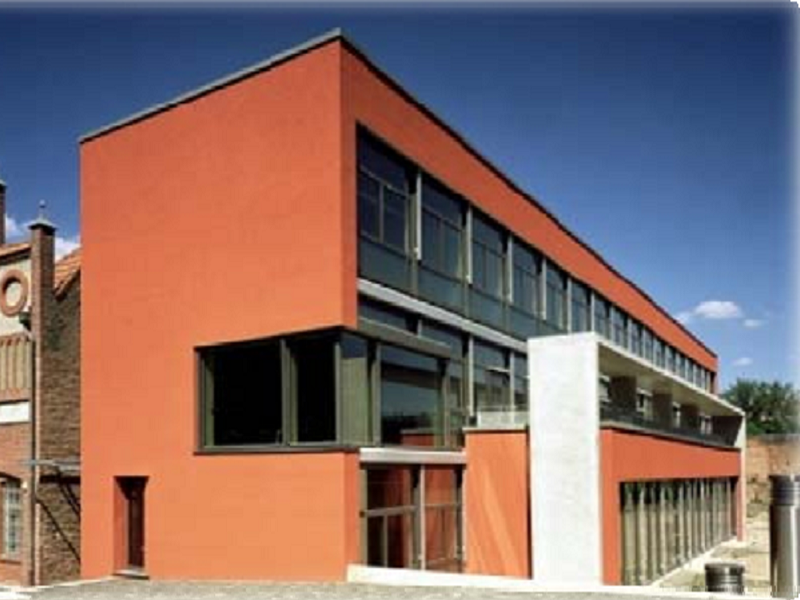
TUC Campus in Chania
The research leading to these results has been partially funded by the European Commission FP7-ICT-5-3.5, Engineering of Networked Monitoring and Control Systems, under the contract #257806and AGILE.
Test Case Description:
In order to evaluate Model-Based PCAO, Fully Adaptive PCAO (also abbreviated as Model Free PCAO), tests were conducted in a 2-floor office building. The test case building is located in the Technical University of Crete (TUC) Campus in Chania, Greece (see Figure 1). All ten thermal zones of the building are equipped with an air conditioning unit, indoor temperature and humidity sensors. The building is also equipped with a photovoltaic (PV) panel, providing solar energy to the building. The building is a conventional building with poor insulation characteristics which render the problem of efficient BOC system design extremely challenging due to the large amount of thermal losses.
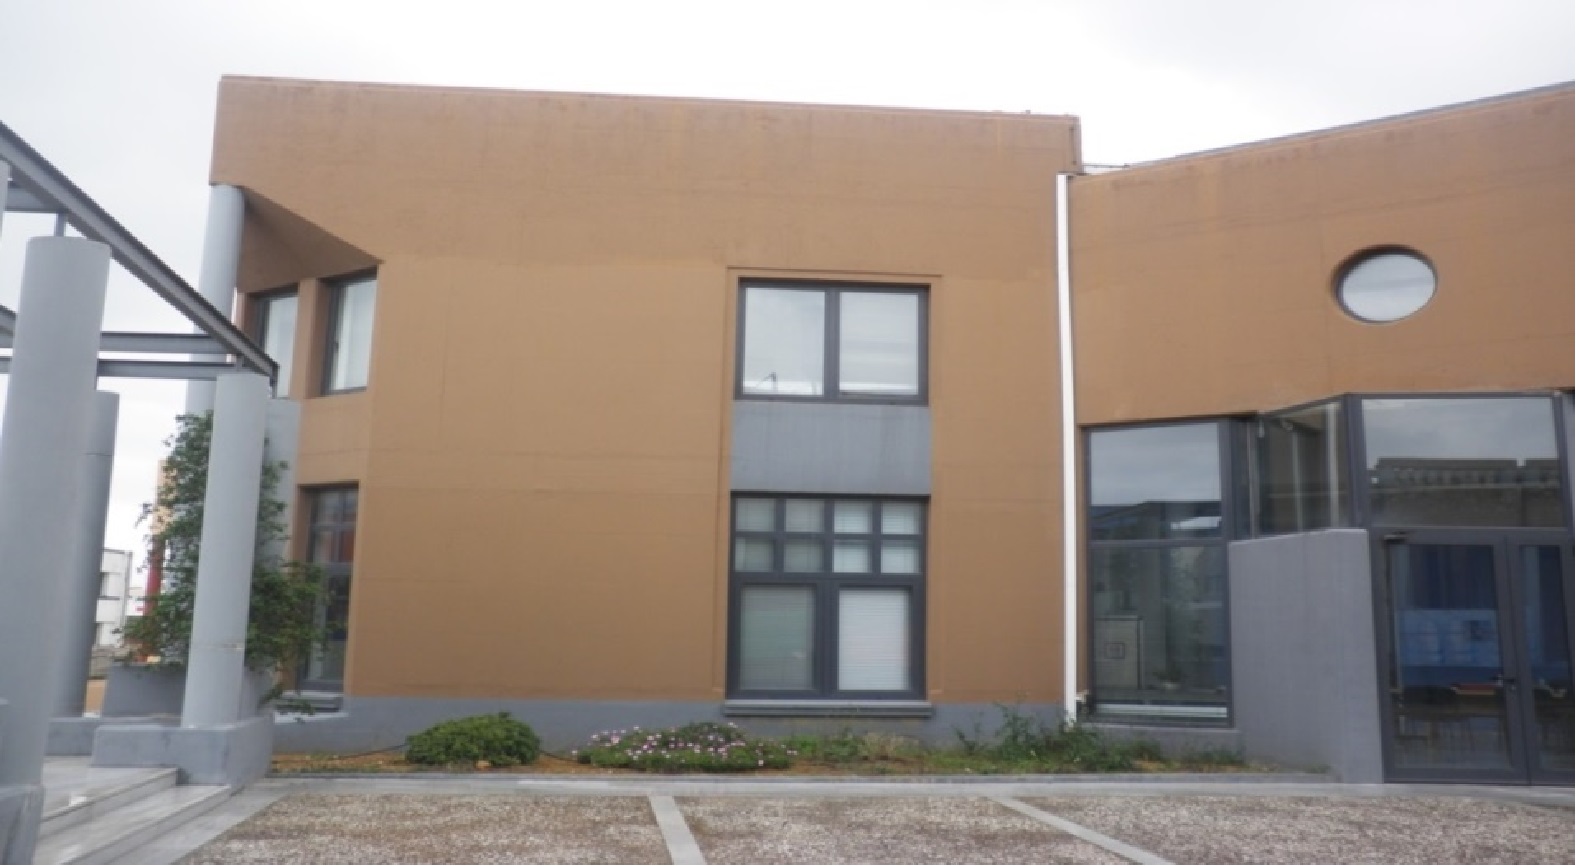
The energy consumption of the TUC building is highest during the summer period for cooling the interior offices. The energy consumption of the specific building is 130 kWh/m2. Large glass surfaces, combined with the torrid Greek summer and the poor insulation factor of the building, lead to overheating the building. For these reasons, the BOC problem for this building will concentrate on cooling the thermal zones during summer.
Some other features of the building:
- The TUC building is a conventional building that has been constructed using no passive techniques. As a result, the building falls into the category of light weight buildings because of the huge thermal losses.
- Despite the fact that the dynamics involved are much faster than in the German building, the quantity on energy involved in the building is almost one order of magnitude larger than in the German building. For this reason the economic impact of a well designed BOC system will be bigger for such building.
- The problem of efficient BOC system design becomes complex due to the locally installed photovoltaic array. In such a case, the BOC system design must be able to perform efficient demand shaping so as to minimize the building’s energy requirements from the grid. Efficient demand shaping, however, not only requires the BOC system to handle efficiently the poor insulation characteristics of the building but also to pro-actively schedule the HVAC settings so as to minimize the energy requirements from the grid. Conventional grid power is still the main energy source (e.g. on cloudy days when the sun isn’t shining, or on winter periods). The solar panel can however be used to increase the resilience of the building with respect to the traditional grid.
- For this kind of building the objective would be to approach as much as possible (during summer) the behaviour of a zero-energy building, i.e. of a building with zero net energy consumption, meaning the total amount of energy used by the building is equal to the amount of renewable energy created on the site. The term “as much as possible” is used since the solar panel, especially during peak hours, cannot satisfy completely the energetic needs of the building. Besides, this chapter considers the energy consumption arising from the cooling task. The energy required for other tasks, illumination, computers and other electrical devices, is not assumed to be controllable.
- Available simulation model in EnergyPlus simulation environment.
Cost Function:
The cost function index is expressed by the total cost of the building, which consists of the energy cost term and the thermal discomfort term:
(1) ![]()
where k is a weight factor to regulate the balance between the energy use and user discomfort. At time t, ![]() is given in kWh and
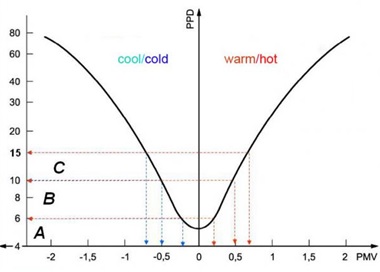
is given in kWh and ![]() in percentage of dissatisfied persons. The energy cost of the building can be evaluated by the difference between the energy demand of that building and the solar energy (if available) delivered to that building. Different metrics are available for the thermal discomfort. In one of the most popular metrics, elaborated in the 70’s by Fanger, the thermal discomfort is evaluated via the Predictive Mean Vote (PMV). The PMV is the index that provides the average thermal sensation of a large group of people. It is based on Fanger’s comfort equation, and it is derived by combining six parameters (air temperature, mean radiant temperature, relative humidity, air speed, metabolic rate, and clothing insulation). The result of the PMV model is expressed in the 7-point ASHRAE scale (+3 till -3, where +3=hot and -3=cold). To ensure a comfortable indoor environment the PMV must be maintained at 0, with a tolerance of ± 0.5 units. The PMV can be translated into the Predicted Percentage of Dissatisfied people (PPD) via the following formula:
in percentage of dissatisfied persons. The energy cost of the building can be evaluated by the difference between the energy demand of that building and the solar energy (if available) delivered to that building. Different metrics are available for the thermal discomfort. In one of the most popular metrics, elaborated in the 70’s by Fanger, the thermal discomfort is evaluated via the Predictive Mean Vote (PMV). The PMV is the index that provides the average thermal sensation of a large group of people. It is based on Fanger’s comfort equation, and it is derived by combining six parameters (air temperature, mean radiant temperature, relative humidity, air speed, metabolic rate, and clothing insulation). The result of the PMV model is expressed in the 7-point ASHRAE scale (+3 till -3, where +3=hot and -3=cold). To ensure a comfortable indoor environment the PMV must be maintained at 0, with a tolerance of ± 0.5 units. The PMV can be translated into the Predicted Percentage of Dissatisfied people (PPD) via the following formula:
(2) ![]()
To achieve acceptable thermal conditions (± 0.5 units of PMV), the PPD must be keep approximately below 10%, as shown below.
Real-Life Results:
The real-life tests took place during summer of 2012 and 2013 aiming to minimize the energy demand for cooling purposes. It has to be emphasized that the analysis of the results of the experiments must take into account the poor performance of the building, which renders the control design for such a building a quite difficult and challenging task. Moreover, the fact that the building is poorly insulated renders the building unable to “store” a lot of energy (in its walls and floors) which makes the control problem quite difficult with any control design being unable to provide with impressive improvements.
Note that the average relative humidity was similar in all experiments. As a first step in the evaluation process we matched real-life application days with similar comfort performance for each one of the respective cases of Model-Based, Model-Free and RBC respectively so as to evaluate energy consumption fairly. As a result 3 different Comparative Experimental Groups: each of these groups corresponded to 1 RBC, 1 Model-based PCAO and 1 Fully-Adaptive PCAO experiment, with similar comfort conditions. Unfortunately though this was not enough due to different external weather conditions among each application case and day.
Extensive studies in similar building cases suggest the “5%-1°C rule”:
a 5% increase of power consumption in case of 1°C increase of the outdoor temperature to achieve similar comfort conditions
In such way, a performance projection was enabled among experiments grouped (see for example the cyan dots which correspond to three experimental days that had similar indoor conditions).
- The top figure shows the performance results with no projection where a straightforward comparison among each group components was not absolutely fair.
- The middle figure shows the results after adopting a conservative rule which considers an energy consumption increase of 3% for each additional ambient temperature degree. You may see that in all groups the PCAO application cases are able to achieve a more energy efficient control strategy with respect to the RBC.
- The bottom figure shows the results after adopting the 5%-1degree rule. You may see in this case too, that PCAO again achieves more energy efficient control strategies.
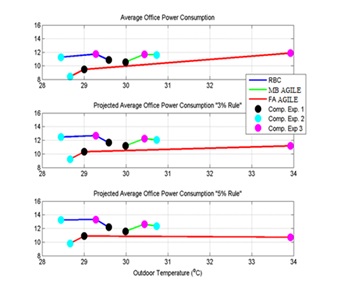
From this figure, the following can be concluded:
- Model-based PCAO achieves 5-7% improvements as compared to RBC, while the Fully Adaptive PCAO achieves improvements of around 19% for the same or better comfort conditions than the RBC.
- In Comparative Experiment Set 1: the initial office temperatures are almost the same for all three Building Control systems (RBC, Model-based and Fully Adaptive), while the Fully Adaptive system achieves significantly higher temperature reductions in the office. As a result, for these two experiments, the 19% improvements of the Fully Adaptive system is rather an underestimation of the Fully Adaptive abilities as these improvements are achieved with the Fully Adaptive system cooling the offices significantly higher than RBC and Model-based PCAO.
- In Comparative Experiment Set 2: the average initial office temperatures and the average office temperature reductions are about the same for all three systems, and thus the energy improvements achieved provide a quite accurate estimate of the actual improvements for this experiment.
- Finally, in Comparative Experiment Set 3: all three systems achieve pretty much the same office temperature reduction, but the Fully Adaptive system starts from significantly lower office temperatures (this has happened as the HVACs were operating during the night before the Fully Adaptive experiment). Therefore as in the case of experiment 1, the 19% improvement for the case of experiment 3 is rather an underestimation of the Fully Adaptive abilities as these improvements are achieved with the Fully Adaptive system starting with significantly cooler office temperatures than those of RBC and Model-based PCAO.
No matter the Ambient temperature projection rule adopted, the Model-Based control design achieves improvements over 5% with respect to the rule-based reference control. Moreover the Fully-Adaptive approach outperforms both the Model-Based and the rule based reference control, reaching improvement levels over 20%. Such observation is reasonable due to modelling inaccuracies and simplifications.

